CloudWatch Insights Tricks

I've learned several undocumented tricks log diving with CloudWatch Logs Insights. In this "Dropping the K" post I'll share some of my favorites.
Sane formatting using the AWS CloudWatch Insights CLI
When you run a query against CloudWatch Logs Insights using the AWS CLI, the results are returned in a completely insane JSON blob. Here's how to use JMESPath to format the results with a header and a single row per entry. Assuming QUERY_ID is set to the query id you want formatted results for:
aws logs get-query-results --query-id $QUERY_ID \
  --query "[@][?status=='Complete'].results[*][?field!='@ptr']. [field,value]|[][*][0] | [0]" \
  --output text --no-paginate
aws logs get-query-results --query-id $QUERY_ID \
  --query "[@][?status=='Complete'].results[*][?field!='@ptr'].[field,value]|[][*][1]" \
  --output text --no-paginate
prints this:
route   bin(1h) count()
/webcredentials/:account    2023-05-10 21:00:00.000 5
/webcredentials/:account    2023-05-10 20:00:00.000 1
/login  2023-05-10 15:00:00.000 1
/federate/:account  2023-05-10 21:00:00.000 1
/federate/:account  2023-05-10 20:00:00.000 2
/federate/:account  2023-05-10 19:00:00.000 1
/federate/:account  2023-05-10 18:00:00.000 1
/federate/:account  2023-05-10 15:00:00.000 1
/device/cookie  2023-05-10 19:00:00.000 1
instead of this insanity:
{
    "results": [
        [
            {
                "field": "route",
                "value": "/webcredentials/:account"
            },
            {
                "field": "bin(1h)",
                "value": "2023-05-10 21:00:00.000"
            },
            {
                "field": "count()",
                "value": "5"
            }
        ],
        [
            {
                "field": "route",
                "value": "/webcredentials/:account"
            },
            {
                "field": "bin(1h)",
                "value": "2023-05-10 20:00:00.000"
            },
            {
                "field": "count()",
                "value": "1"
            }
        ],
        <snip>
    ],
    "statistics": {
        "recordsMatched": 14.0,
        "recordsScanned": 133.0,
        "bytesScanned": 41286.0
    },
    "status": "Complete"
}
Deeplinking to the log stream when using multiple log groups
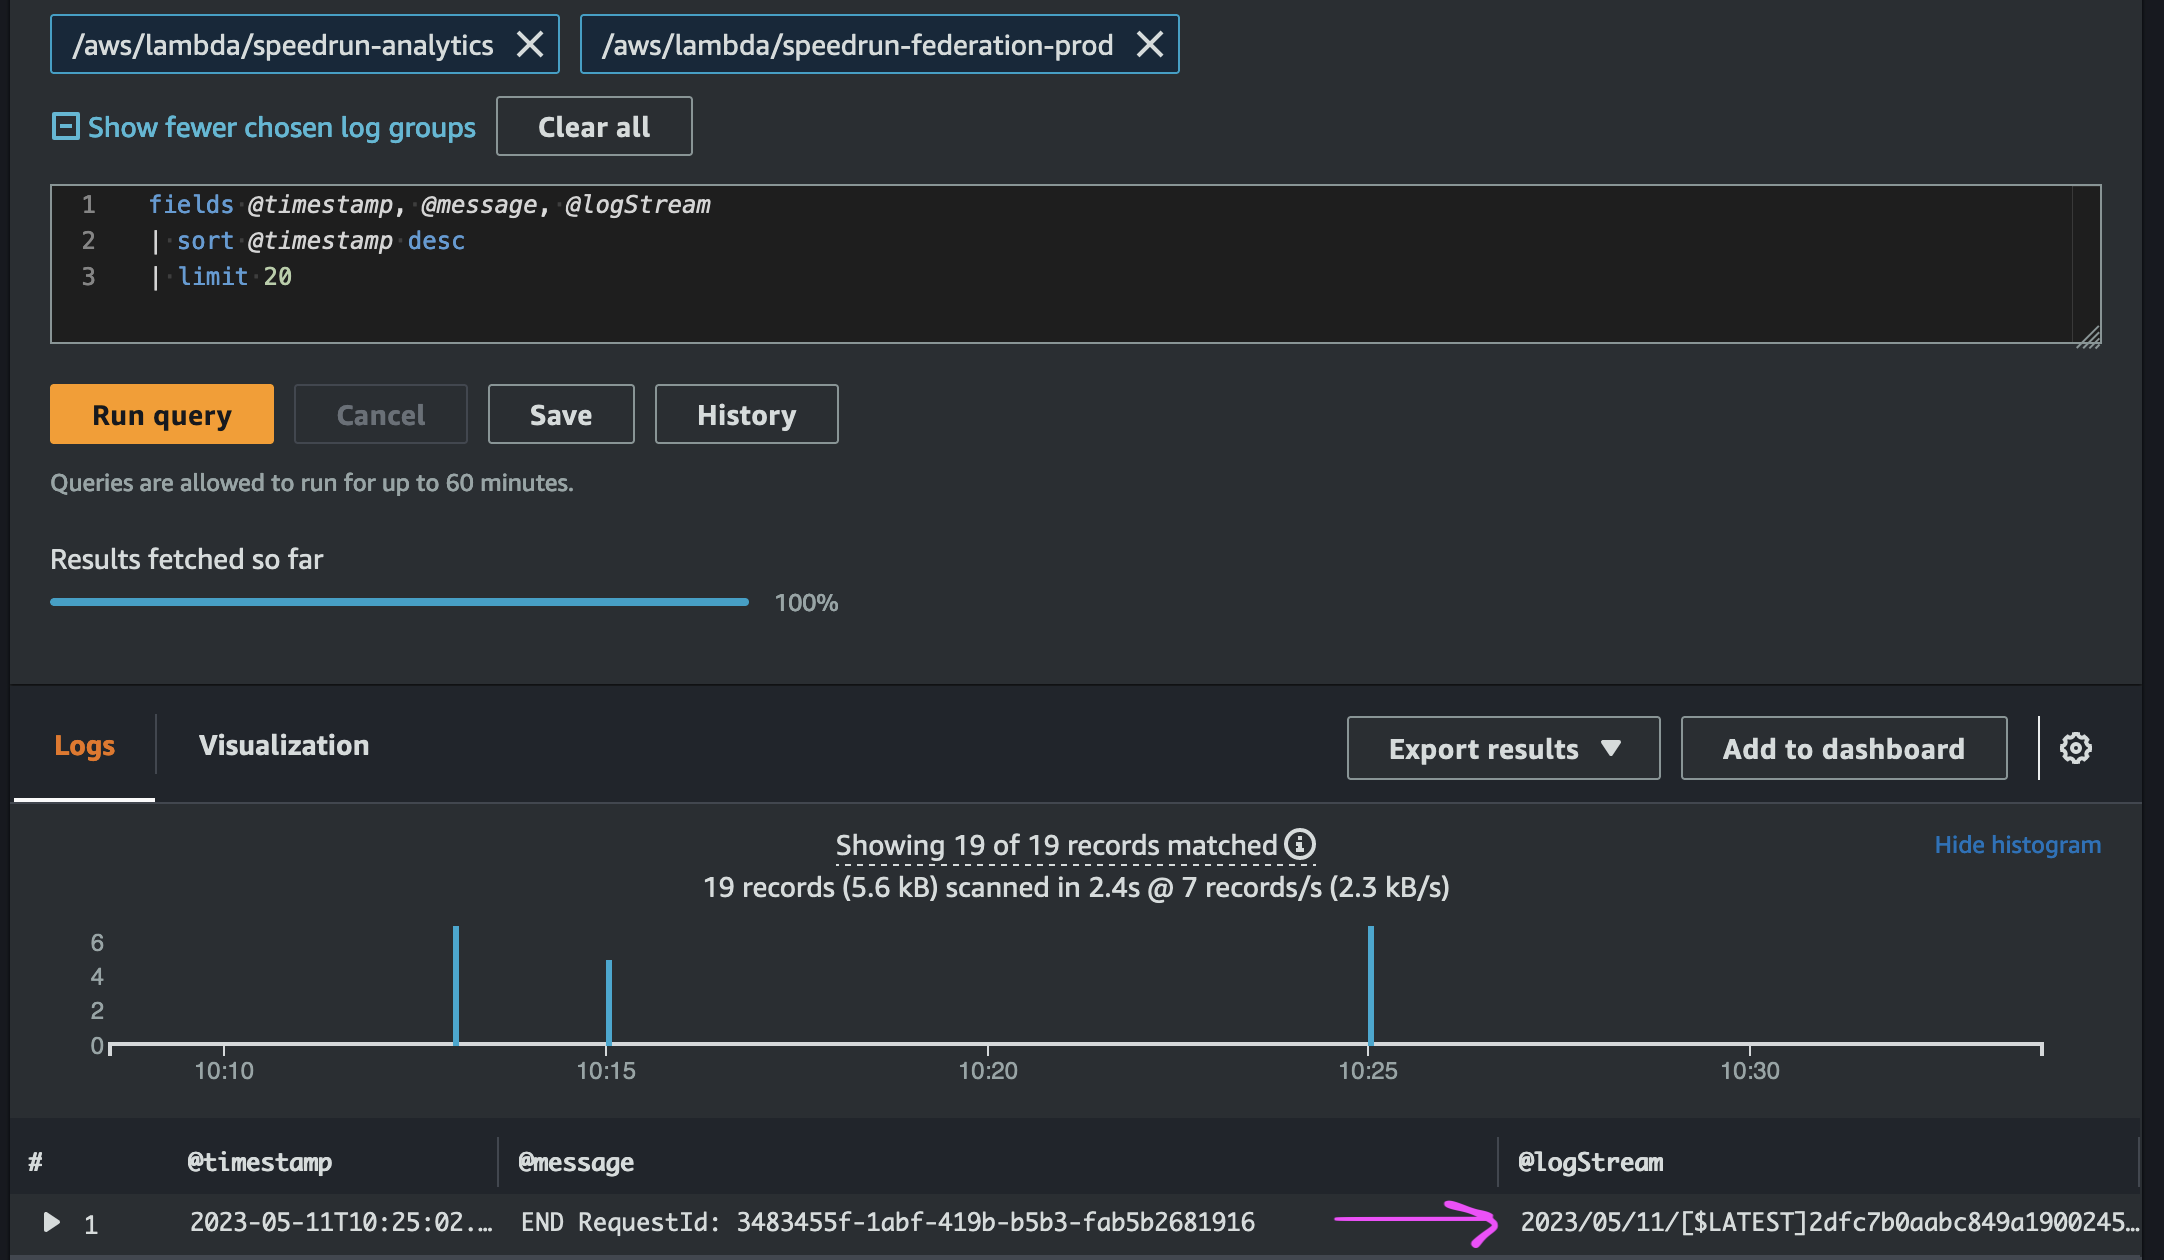
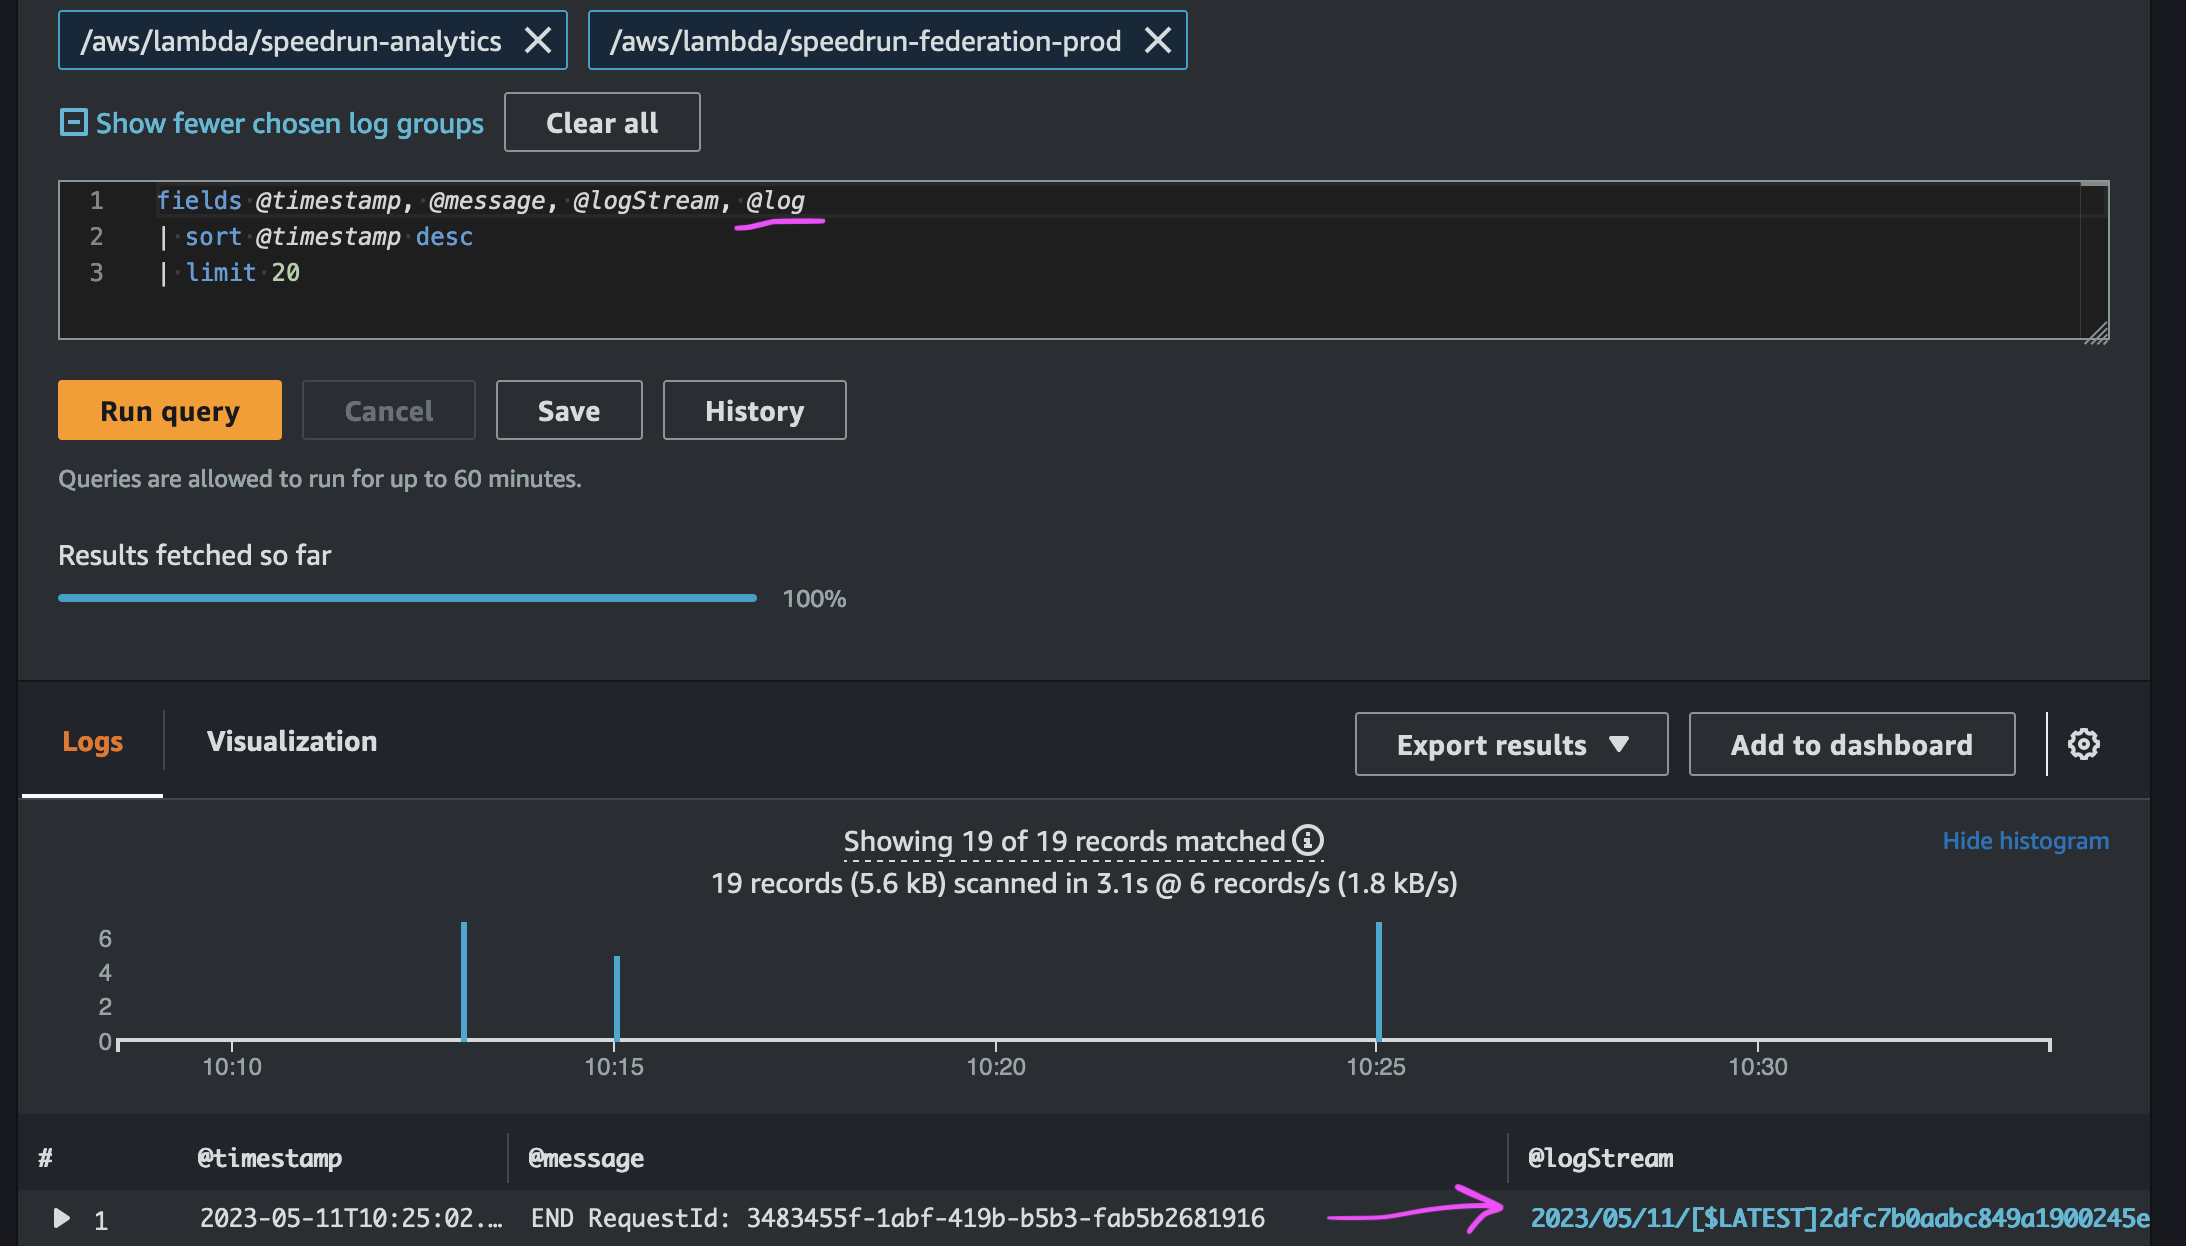
When you use CloudWatch Insights to query one log group, it automatically deeplinks to the log stream. When you query multiple log groups, you need to add @log to the fields to get the console to deeplink to the log stream.
Without @log:

With @log:

Using emojis
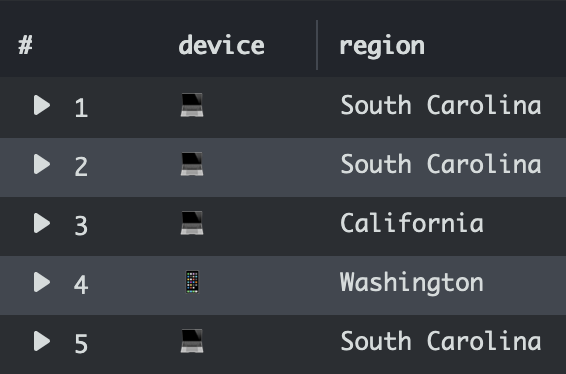
On a dashboard, you can use emojis to convey more information at a glance. For example, if you want to visualize whether someone used a computer or a handheld device, you can use emojis to succinctly display that. Use the replace function to replace a string with an emoji. Here's how I extract the device type from a CloudFront log:
parse headers '"cloudfront-is-desktop-viewer":{"value":"*"' as isDesktop
| fields replace(replace(isDesktop, 'true', '💻'), 'false', '📱') as device

Aggregating multiple log lines
Sometimes you need to roll up status across multiple log lines. If you use the CloudWatch Embedded Metric Format (EMF) you'll have 1 log entry per request so the query is simple. But what happens if they aren't structured like that or you are trying to identify the requests that started but never finished?
There are a couple methods to solve this. All of them require you can extract a consistent id from your log lines like a @requestId
The easiest way, is to use latest to get the latest status. For example, if you have a requestId field, you can do this:
filter @message like /^(START|END) /|
parse @message /^(?<@LastMessage>\w+) / |
stats latest(@LastMessage) by @requestId
If a request had a START but no REPORT line, you can use this approach to identify them. The requests that don't have a REPORT would sort first in the results. I added a max(@timestamp) so you can tell whether it didn't have a REPORT because it was at the boundary of your time range.
filter @message like /^(START|END|REPORT) /|
parse @message /^(?<@Report>REPORT) / |
stats count(@Report) > 0, max(@timestamp) as @hasReport by @requestId |
order by @hasReport asc
Getting peak rps for a customer
Sometimes I need to determine peak rps for an API to set throttling limits for a customer or see which customer is hammering my api. The dedup feature can be combined with sort to get the top value. The following query will return the peak timestamp and rps for each route of my api for the user perpil:
filter login='perpil'
| stats count() as count by bin(1s), login, route
| sort count desc
| dedup login, route
| bin(1s) | login | route | count |
|---|---|---|---|
| 2023-10-24 23:26:37.000 | perpil | /credentials/:account | 3 |
| 2023-10-22 13:59:31.000 | perpil | /federate/:account | 1 |
| 2023-10-24 23:26:34.000 | perpil | /device/cookie | 1 |
| 2023-10-23 16:18:32.000 | perpil | /login | 1 |
Conclusion
That's all for now, if you're struggling with a query, feel free to reach out to me on Twitter I may know the answer.
