Bespoke CloudFront Edge Metrics

When I migrated the Speedrun API from API Gateway to CloudFront, I lost an important latency metric; End-to-End (E2E) API latency. Detailed CloudFront metrics provide this latency metric and a few others, but I was curious to see if I could get more granular. Could I get realtime origin latency by edge location, software version and whether there was a coldstart? Kind of. In this post, I'll show how I used CloudFront Functions and the Embedded Metrics Format (EMF) to obtain more insight into my end user latency.
Background
 Before migrating to CloudFront, I used a regional API Gateway with a Lambda proxy integration (shown in
 green box above). This setup provided latency metrics, but since it was a regional API Gateway, it masked most of the network latency between my API and my users. If the end user was geographically far from my API, they would experience much higher latency than what the metrics showed. With CloudFront (shown in the orange box above), I could measure the latency from the edge location to the API. Since the edge location is geographically close to the end user, I get a more accurate view of the latency my end users experience. As you can see above, with CloudFront the measured latency (blue) captures more of the latency than what is hidden (red).
Approach
CloudFront allows you to run little bits of JavaScript on the edge with CloudFront Functions. Here we'll use them to read headers and emit logs on both the viewer request and response. To get the origin latency, we'll inject a header called x-request-time and calculate the delta using the current time in the response. To get the software version, coldstart and other metadata, we'll set them in our API as x-meta-* headers in the response. We'll combine those headers with latency and location information from CloudFront and emit it to the log in the Embedded Metrics Format (EMF). That will allow us to query them using CloudWatch Logs Insights and set alarms using CloudWatch Alarms.

Why not just use CloudFront access or real-time logs?
In addition to those logs requiring a more involved workflow to process, they don't include response header information. Consequently, I can't enrich them with metadata like software version, API request id or whether my API had a coldstart. Without this enrichment, I can't slice the data to extract the insights I want.
The Code
The code to do this is fairly simple. I've created a CDK project that you can use to get started. Most of the interesting parts are in the CloudFront Function. Here's the code:
| metricsAspect.js | |
|---|---|
1 2 3 4 5 6 7 8 9 10 11 12 13 14 15 16 17 18 19 20 21 22 23 24 25 26 27 28 29 30 31 32 33 34 35 36 37 38 39 40 41 42 43 44 45 46 47 48 49 50 51 52 53 54 55 56 57 58 59 60 61 | |
And the Lambda function code:
| handler.js | |
|---|---|
1 2 3 4 5 6 7 8 9 10 11 12 13 14 15 16 17 18 19 | |
Tip
Any header that starts with x-amz like x-amzn-requestid or x-amz-cf-pop isn't available in a CloudFront function viewer response even if they are returned to the viewer. To get request id of the API, I had to use a different header name. I used x-meta-requestid to get the requestid as a response header from my API.
Metrics and Slicing and Dicing the Data
Now that I have metrics, I can view them in CloudWatch Metrics and set Alarm thresholds.
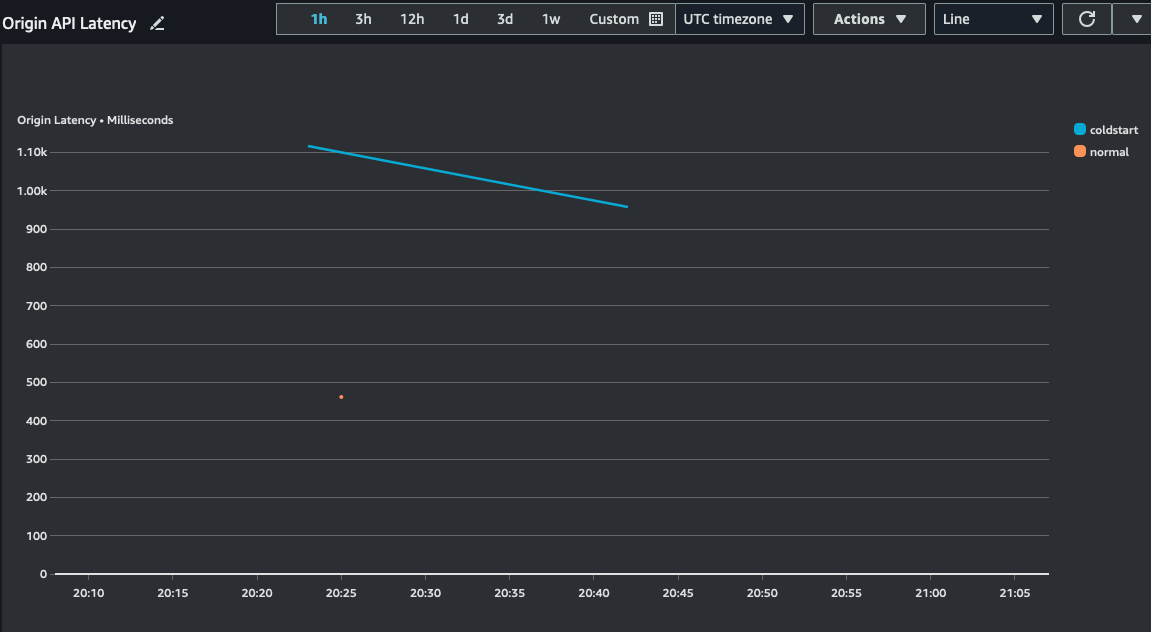
But because they are just logs, I can slice and dice them in dimensions I didn't emit a metric for. Using a CloudWatch Insights query like this, I can get average origin latency by viewer location and lambda deployment version and compare coldstarts to non-coldstarts:
filter strcontains(@message, '_aws') |
parse @message "\"originLatency\":*," as originLatency |
parse @message "\"requestId\":\"*\"" as requestId |
parse @message "\"functionVersion\":\"*\"" as functionVersion |
parse @message "\"coldstart\":\"*\"" as coldstart |
parse @message "\"cfCity\":\"*\"" as cfCity |
parse @message "\"cfCountry\":\"*\"" as cfCountry |
stats avg(originLatency) by functionVersion, coldstart,cfCity,cfCountry
| functionVersion | coldstart | cfCity | cfCountry | avg(originLatency) |
|---|---|---|---|---|
| 5 | true | Seattle | US | 1037 |
| 5 | false | Seattle | US | 462 |
This is useful for understanding whether I have latency regressions across code deployments.
Tip
The metrics and logs are always published in us-east-1 for CloudFront functions. If you can't find them, double check your region.
Cost
Beyond your standard CloudFront and Lambda costs, this approach will incur costs for CloudWatch Logs, CloudWatch Metrics and CloudFront Function Invocations.
Logs are priced at $0.50 per GB ingested and $0.03 per GB archived. Metrics are priced at $0.30 per metric per month and this produces 2. CloudFront Functions are priced at $0.10 per million invocations. The CloudFront invocations will be 2x the number of requests to your API because each request triggers a viewer request and response.
If I may be so bold
There are a couple of AWS limitations that make this slightly less effective than I'd like:
- The CloudFront Function does not run on any response that has a status code >=400. You will not get metrics on your errors.
- The CloudFront POP location isn't available to the CloudFront function. Instead of having a nice clean origin latency for each edge location, I have to use the viewer city and country. This isn't as accurate as using the edge location and sometimes city isn't available. If it was available in the context, that would be very useful (and if request time was also there I'd only need to do work in the viewer response).
- CloudWatch Logs Insights doesn't natively parse the json out of logs from CloudFront Functions. It chokes on the CloudFront request id format. Instead of referring to the fields by field name, I have to manually extract them using
parse. This makes the queries harder to write.
If these get fixed, it will simplify the effort and make this approach more useful.
Conclusion
I've demonstrated a method for emitting realtime granular metrics and logs from CloudFront. As long as your API returns information as response headers, you can use this approach with CloudFront to gain insights into your API performance and usage. I'm using a slightly modified version of this to get per route latency metrics for the Speedrun API. If you have questions or issues with the sample code, reach out on Twitter or cut an issue in the GitHub repository
Further reading
- The bespoke-edge-metrics GitHub repository is a working CDK project you can use to experiment with this approach.
- Read about the Embedded Metrics format if you want to change the dimensions or other aspects of the metrics you are emitting.
- I am emitting the metrics as a structured log (sometimes called a request log or canonical log). If you aren't familiar with this type of log, read Logging for Scale to learn about its benefits.