AWS Lambda Request Timeline

Have you ever thought you understood the timeline of a request in AWS Lambda only to stare at your logs and traces and find out that you didn't? The official documentation has diagrams that look pretty, but don't convey everything that is important. In this post I'll present the infographic I use to understand what Lambda is doing and what is and isn't in the logs.
The problem
When you measure client latency of a request to Lambda, you'll get a different latency than if you add up Init Duration and Duration in your REPORT logs. Further, if you look at a trace in X-Ray, you'll see overhead that isn't accounted for in Initialization. To build a complete picture we'll work backward from Wall Clock Time. This is the time it takes from when Lambda receives the request to when it returns the response.

The timeline
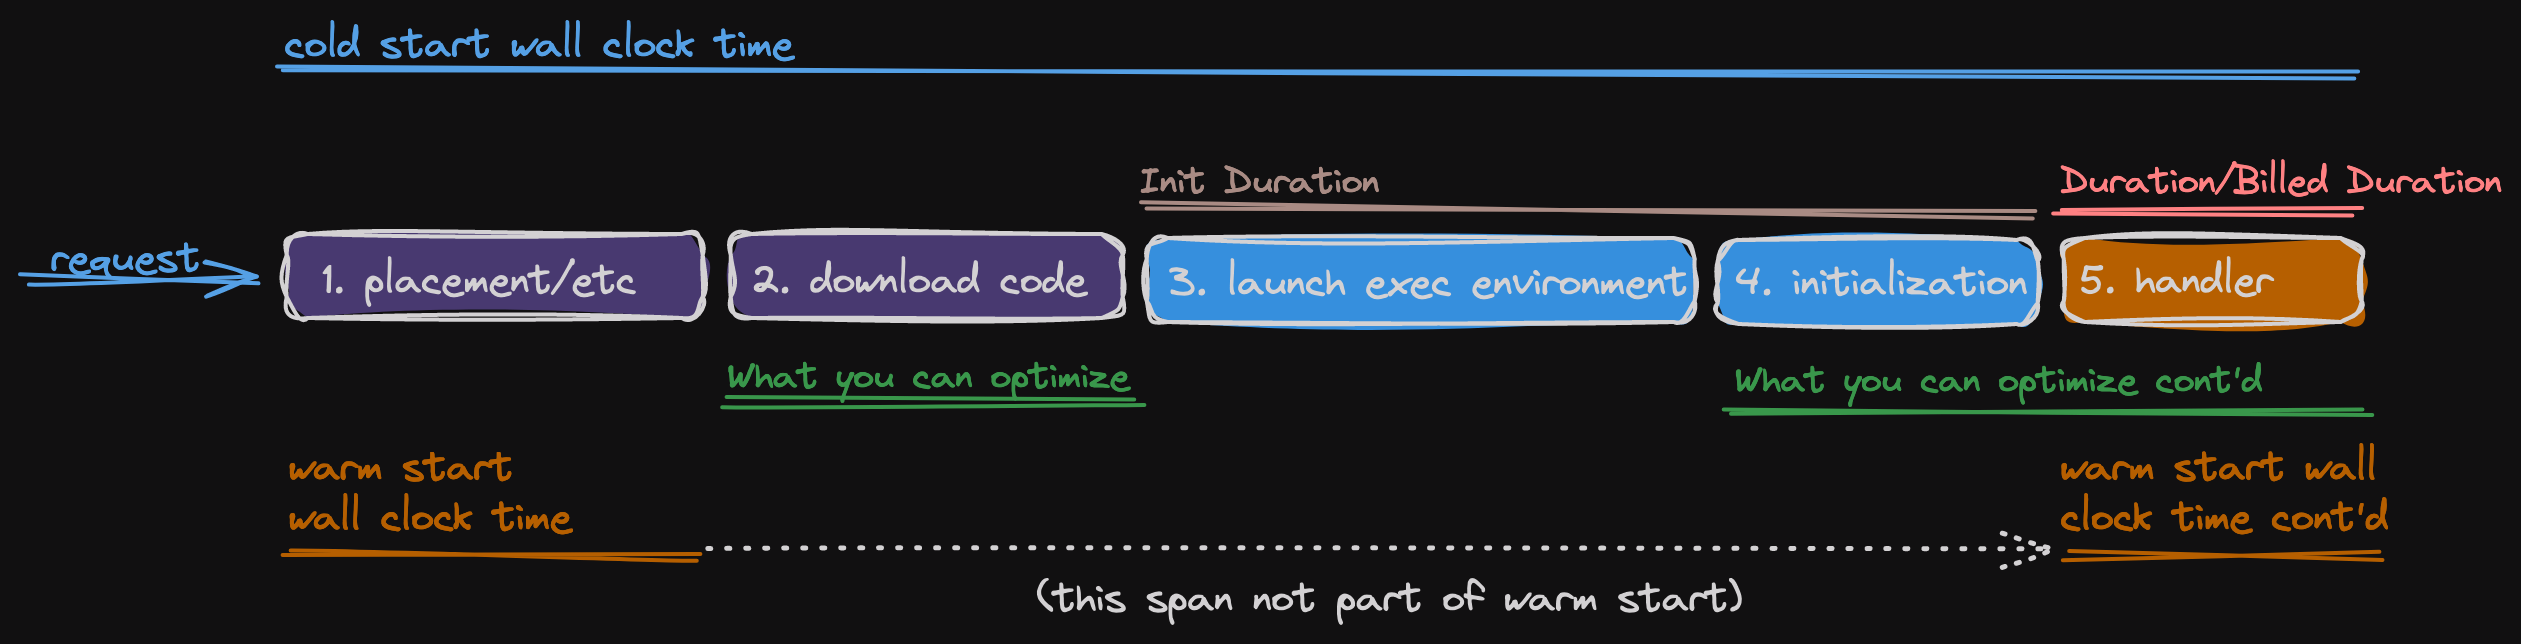
When Lambda receives a request it roughly follows the numbered segments above.
- Placement/etc. This includes doing authorization, checking concurrency/throttling, finding a worker to handle the request.
- Download code/env prep. The time spent downloading your code, getting execution role credentials from STS and decrypting environment variables with KMS. It only happens during a cold start.
- Launch exec environment. This includes starting the microVM, putting your code in it and starting the runtime. It only happens during a cold start.
- Initialization. The time spent running your initialization code. It only happens during a cold start.
- Handler. The time spent running your handler code.
Now what?
With this timeline, we can understand what we see in the logs, define some terms and learn what we can optimize.
What is Init Duration in the logs?
This includes the time spent launching the exec environment and calling your initialization code outside of the handler. Notably absent is the placement and downloading code/env prep segments. The time spent downloading your code from S3, getting credentials and decrypting environment variables is not included in Init Duration.
What is Duration in the logs?
This includes the time spent running your handler code.
What is Billed Duration in the logs?
Starting August 1st, 2025, it is Init Duration + Duration rounded to the nearest ms. Prior to August 1st, 2025, Billed Duration was the same value as Duration rounded up to the nearest ms for managed runtimes.
What happens during a cold start?
All of the segments happen.
What happens during a warm start?
Only the placement and handler segments happen. There is no Init Duration in the logs, only Duration and Billed Duration.
What segments can I optimize?
You can optimize downloading the code/env prep by reducing the size of your bundle using tree shaking and minifying your code 1 or by removing environment variables 2. You can optimize initialization by lazy loading3 modules you need in low traffic code paths and tree shaking and minifying your code1. You can optimize your handler by tree shaking and minifying1 your code.
How should I measure Lambda latency?
A good place to measure latency is just before Lambda because Lambda logs/duration metrics only tell a partial story. The Duration metric of Lambda doesn't include the initialization time or any other segments, only the time spent in the handler! If you have an API Gateway in front of Lambda, you can use the API Gateway IntegrationLatency metric as a close approximation. Keep in mind measuring latency from the client includes network overhead which is outside of Lambda.
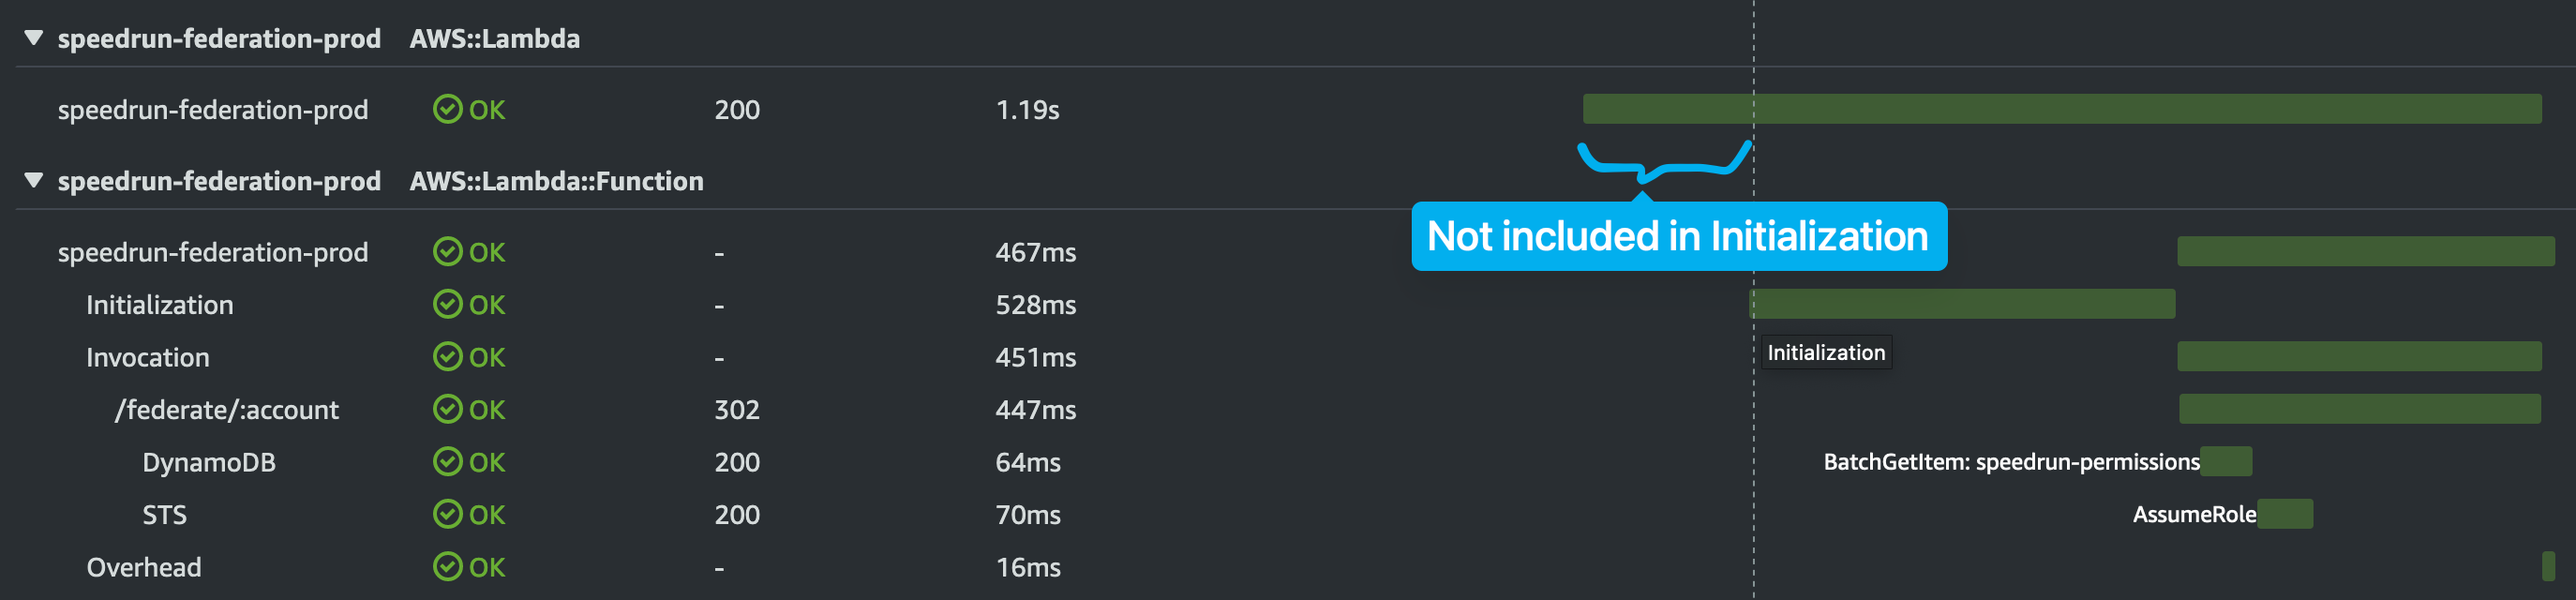
What does a X-Ray trace show?
I'm not 100% sure on this one. In the X-Ray diagram above, I believe the AWS::Lambda segment that is 1.19s includes all the segments in the infographic, but it could be some subset. Initialization corresponds to Init Duration and Invocation corresponds to Duration. If I can get clarification from the Lambda team, I'll update this post.
Conclusion
I hope the infographic clarifies what Lambda is doing and what you see in the logs. I also hope it provides more insight into how to measure latency and what you can optimize. If you have comments or suggestions on how to make it better, reach out to me on Twitter.
Further reading
- The AWS Lambda Execution Environment has the diagrams I started from.
- The Lambda Log Structure.
- Important Lambda Metrics.